

Very Short Question Answer
1. Who developed IS-LM model?
IS-LM model was developed by J.R. Hicks in 1937 A.D.
2. Define IS curve.
IS curve is defined as the locus various combinations of rate of interest and level of income which gives product market equilibrium.
3. Define LM curve.
LM curve is the locus of various combinations of rate of interest and level of income which gives money market equilibrium.
4. How is general equilibrium determined according to IS-LM model?
According to IS-LM model, general equilibrium is determined at the point where IS and LM curves intersect with each other.
5. What do you mean by product market?
Product market is the market where business and consumers interact to buy and sell the output of goods and services produced by an economy.
6. Define the meaning of money market?
Money market is defined as the market for short-term financial assets, funds, credits, etc. for less than one year.
Short Question Answer
1. Define IS curve. Derive it graphically. or, Define IS curve. Explain the product market equilibrium. or, How is product market equilibrium derived? Explain with the help of IS curve.
IS curve is the locus of various combination of rate of interest and level of income such that goods market is in equilibrium. IS curve shows goods or product market equilibrium at its each points. In other words, IS curve shows the combinations of interest rates and level of income such that planned spending equals income. IS curve was explained by J.R. Hicks in 1937 AD.
DERIVATION OF IS CURVE (PRODUCT MARKET EQUILIBRIUM)
IS curve shows goods or product market equilibrium. It is the graphical representation of various combinations of rate or interest and level of income which gives goods market equilibrium. To explain IS curve, Hicks has used Keynesian consumption saving function and investment function.
Investment is the negative function of rate of interest where as saving is the positive function of rate of interest. Therefore, saving curve slopes upward and investment curve slopes downward. Saving is also positive function of level of income.
For equilibrium in the product market,
AD = AS
or C+I=C+S
or, I = S
Where,
AD = Aggregated demand
AS = Aggregated supply
C = Consumption
I= Investment
S = Saving
The following diagrams show the derivation of IS curve:
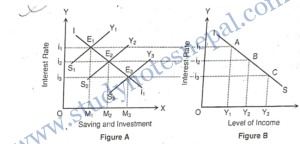
In the above figure A, X-axis represents saving and investment and Y-axis represents rate of interest. The downward slopping curve Il represents investment curve and upward slopping curves S₁Y₁, S2Y2 an S3Y3 represent saving curves at different levels of income Y₁, Y2 and Y3 respectively. Let us, suppose, E, is the initial equilibrium point where saving equals to investment at the rate of interest i, and level of income Y₁. When rate of interest falls, investment increases. At rate of interest i2, there is increase in both saving and income. It is shown by equilibrium point E2. Similarly, new equilibrium point is established at E3, where saving-investment equality is maintained at the rate of interest i3 and income Y3.
With the help of corresponding equilibrium points of figure A, IS curve can be derived in the Fig. B. Based on the equilibrium points E₁, E2 and E3. saving investment equalities are maintained at various rates of interest i, 12 and is and various levels of income Y₁, Y₂ and Y3 respectively. By joining points A, B and C, respectively, we get IS curve. It shows equilibrium in the real sectors or ‘product market’. It slopes downward to the right. It is because at higher level of income, saving is greater. Greater the saving lower will be rate of interest. As rate of interest falls, investment increases till it becomes equal to higher savings. Thus, as income increases, the equality between saving and. investment is established at a lower rate of interest.
2. Explain the general equilibrium in the product market and money market.
The general equilibrium in the money market and product market is determined from the intersection between IS and LM curves. IS curve is the locus of various combinations of rate of interest and level of income such that product market is in equilibrium where as LM curve is the locus of various combinations of rate of interest and level of incomes such that money market is in equilibrium.
According to modern theory, intersection point of IS and LM curve determines the equilibrium interest rate and level of income where both money and product market are in equilibrium. This is known as the general equilibrium. This can be shown by the help of following diagram:
In the figure, IS curve is slopping downward and LM curve is slopping upward. These two curves are intersecting each other át point E. The point is the equilibrium point. At this point, both product and money market are in equilibrium. This point is known as the general equilibrium point. The general equilibrium income level is OY, and general equilibrium rate of interest is Oio.
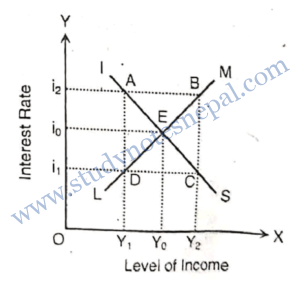
Let us consider, point A on IS curve representing the combination of OY₁ level of income and Oi₂ interest rate. At this point, product market is in equilibrium because point A is on the IS curve but money market is not in equilibrium. At point B of LM curve, money market is in equilibrium at interest rate Oi2 and level of income OY₂. But at this point, product market is not equilibrium. Similarly, at point C product market is equilibrium but money market is not in equilibrium and at point D, money market is equilibrium but product market is not equilibrium. Hence, only the point E is the equilibrium point, which shows equilibrium in both money and product market. This is also known as the general equilibrium in the economy.